Google Tools You Didn’t Know About
#1 Google Consumer Barometer
Learn how people around the world use the internet + make purchase decisions
Google’s Consumer Barometer is sure to be super helpful for anyone seeking market-specific research on how people use and have used the internet to shop, communicate, and watch. It is basically a storehouse of Google survey data to internet users compiled over time and easily accessible and exportable via custom charts and graphs. There are four main sections – Graph Builder, Trended Data, Audience Stories, and Curated Insights.

Source: Consumer Behavior UK
Graph Builder allows you to select specific survey questions from the most recent results, view their responses based on a variety of filters, and export the resulting graphs to a png or CSV format. Questions are separated into three different themes: The Online & Multiscreen World, The Smart Shopper, and The Smart Viewer.
Trended Data is a similar idea to Graph Builder; however, it allows viewing of survey responses to specific questions over time and with fewer filtering capabilities (just country, and gender or age range). The data is displayed in pretty, premade graphs that you can also export as a png or CSV.
Audience Stories give more in-depth insight into high-value audience segments (Brand Advocates, Digital Moms, How-To Video Users, and The Millenials). Learn about their online behavior, purchase patterns, and how to best reach them through curated data and observations from Google.
Curated Insights brings all of the above together, showing curated data and graphs to give color to different audience segments based on country. You can even open each graph in graph builder to dig further into the survey responses and filter them to get even more tailored data.
#2 Google Market Finder
Find the best international markets for your business
Google’s Market Finder opens with a nifty onboarding tool that allows you to gauge the international market potential of your business by ranking top markets based on their category monthly search volume, recommended AdWords bid, Ease of doing business index ranking, and household net disposable income. You can either input your website URL to be scraped for product categories offered, or select up to five product categories manually.

After that initial information dump, which is helpful in its own right, you are given the option to get more tailored insights into international markets by providing your name, answering whether you sell physical goods or not, and agreeing to have your information used in accordance with Google’s privacy policy. After doing so, you can dig into each of the suggested markets and learn more about their population’s demographic makeup, internet usage, and purchase behavior.
#3 Google Correlate
Explore relative search patterns
Google Correlate began as a project designed to help predict flu trends in a more real-time way than traditional methods. Scientists would use real-world influenza data as input to find out which search queries were best correlated with flu activity – and found that search query activity served as a great indicator of flu activity!
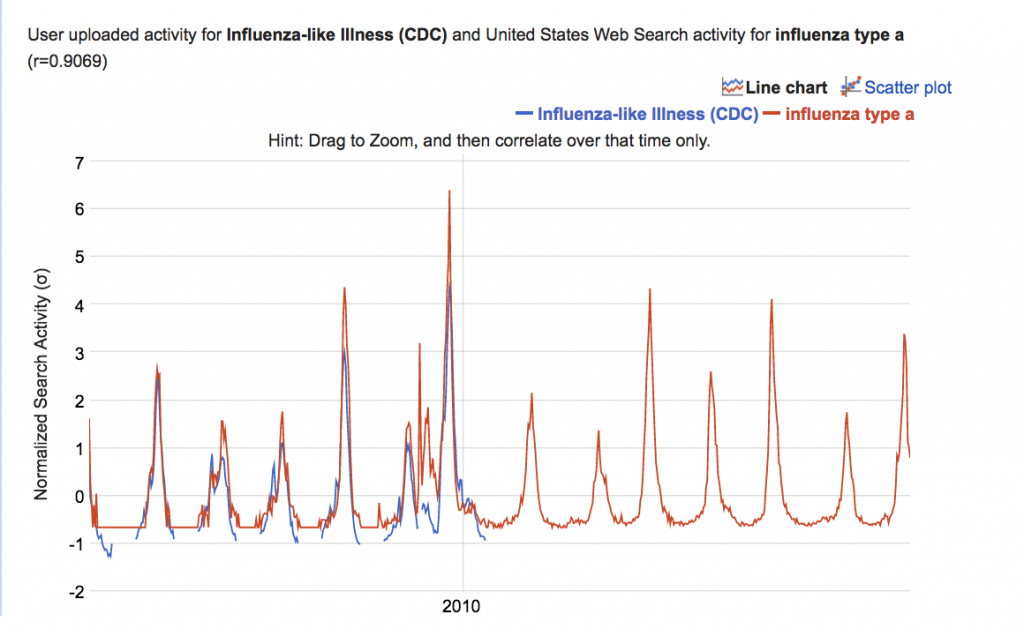
Today, Google Correlate is often described as the inverse of Google Trends. Where in Google Trends you can input a query or topic, and see the “Interest Over Time” for whatever your input was; with Google Correlate you can input a query (or even your own data series about something else entirely, like the scientists, originally did with their flu data) and see queries that follow a similar pattern. These output queries aren’t necessarily related to your original input (remember correlation is not the same as causation), but experience similar patterns over time.
#4 Google Data Studio (open beta)
Connect a variety of data sources + create dynamic, visually completing reports/dashboards
Google Data Studio (currently in beta) is a data visualization and reporting tool that makes creating custom dashboards using multiple data sources easier than ever. With new features rolling out all the time, Data Studio has become a lot more powerful with the ability to connect more than just Google Analytics.

For free users can connect almost any Google data source (Google Analytics, Google AdWords, DCM, BigQuery, etc.), any data input into a Google Sheets file, or even directly upload their own data file to use with Google Data Studio. You don’t even need a Google account to view Data Studio reports.